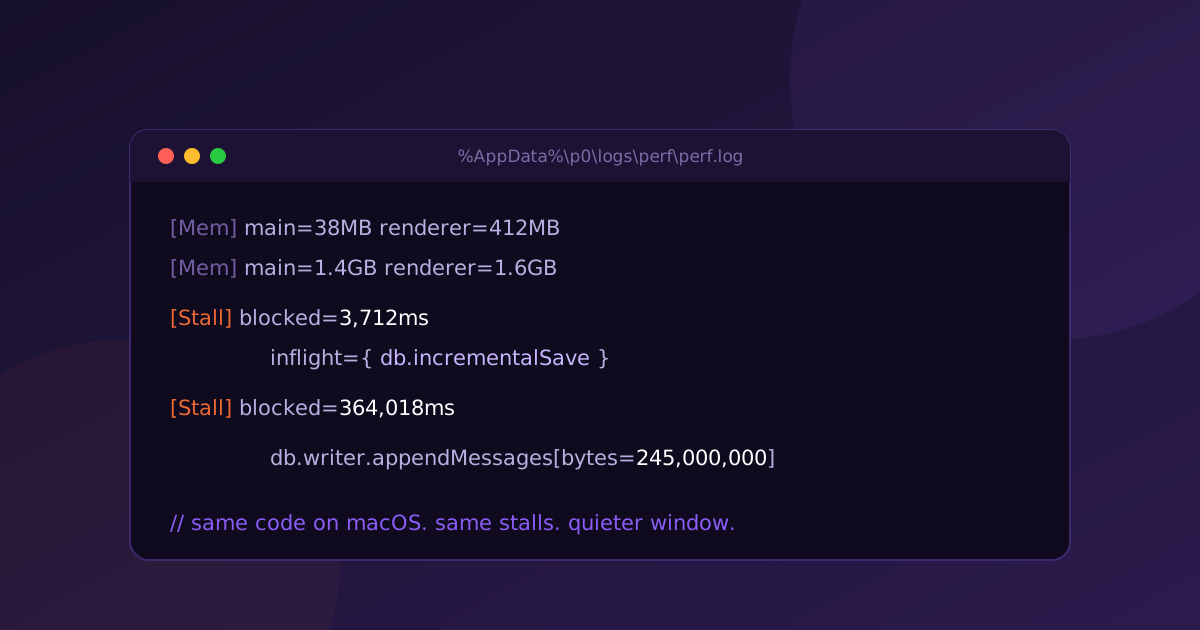
In September a Windows user told us p0 was “not responding.” Typing lagged, and Task Manager showed the window process busy with disk I/O while the app sat idle. A week later another Windows user said their p0 window turned completely white several times a day during long sessions.
We assumed it was a Windows thing. p0 was born on the Mac, and for its first months every machine it ran on was a fast one with plenty of memory. Windows brought p0 to a much wider range of hardware, including corporate laptops with antivirus inspecting every process. Some rough edges were expected.
This one turned out to be something else. The cause was in p0 itself, on every platform. Windows was the first place it became visible. Fixing it is why p0 1.0.67 feels faster whether you’re on a Mac or a PC.
This is how we got there, with p0 doing most of the digging.
Clue one: a diff that didn’t exist
The first user sent a screenshot. Git said their worktree was clean. p0’s Changes footer said 114 files changed, 51,984 lines added.
That was the tell. p0 computes “what changed on this branch” by comparing against the base branch. After a PR is squash-merged on GitHub, that comparison reports the branch’s whole history as pending changes. p0 was regenerating the full diff on every refresh, sending megabytes across the app each time, and refreshing again on every file the agent wrote.
On a Mac this is wasteful. On a corporate Windows laptop where antivirus inspects every git process, it ties up the part of the app that routes your keystrokes, and Windows marks the window “not responding.” We fixed it: skip the comparison for merged PRs, only build the diff text when the Changes tab is open, and refresh less eagerly.
That fixed the typing lag. It did not fix the white window.
Clue two: we couldn’t see it
The white window needed hours of unattended agent work on a real workload, and we couldn’t reproduce it in the office. Our packaged builds only logged errors, so the timing data that would explain a freeze didn’t exist outside dev mode.
So rather than guess, we asked p0 to build us eyes. It added a production-safe stall watchdog: a timer that notices when the app’s main loop blocks for more than a second and writes every stall to a rotating log, together with the names of whatever operations were running at that moment. The log records operation names and durations only. It never contains file paths or message content. We wrapped the suspects, shipped it in a beta, and asked the affected user to run it for a day.
Their log came back and named the culprit directly.
longest single stall:        364 s
stalls over 3 s, one day:    129
each incremental save:       2.1 to 3.7 s
in-flight op:                db.incrementalSave
The turn: it was never Windows
Every two seconds during a streaming turn, p0 saved progress. That save took the entire message history of the chat, serialized it to JSON, and wrote it to the database on the main thread. The history was one JSON blob in one column. The longer your session, the longer every save took, and the save ran every two seconds.
A few other paths did the same thing: a periodic check for pending plan approvals parsed every chat’s history for every open session, and opening a session loaded every chat’s full history instead of only the one on screen. That explained the detail nobody could account for: why a relaunch froze right after the logo, before any agent had started.
None of this is specific to Windows. The same code ran the same way on every Mac we own. The difference is what each operating system does when an app’s main process stops responding. macOS waits and shows you a slightly laggy app. Windows paints the window white. Our Mac users had been running the identical code and experiencing it as “p0 feels a bit heavy in long sessions.”
p0 rebuilt the persistence layer. The in-progress message moved to its own column, so the two-second save writes one message instead of the whole history. Completed messages are appended with string surgery, so the history is never parsed and re-serialized. All writes moved into a worker thread with its own database connection, with a safe fallback if the worker can’t start. On a 90 MB test database, packaged on macOS, constant stalls became zero stalls.
With the watchdog in place we also profiled the production app on a Mac and found more. Creating a session in an 11-repo workspace spawned a git process in 1,187 directories. Replacing that with a single file check took it from 20.7 seconds to 65 milliseconds.
Clue three: the white window came back
Two weeks later, same user, same symptom, different cause.
The log now said reason=oom. The renderer process, the one that draws the window, was being killed for running out of memory. p0’s first move was a safety net: when the renderer dies, reload the window automatically, and stop sending data to a window that isn’t there.
But the spec p0 wrote for the real fix had a line we’ve come to appreciate: “Working hypothesis (to be confirmed, not assumed).” The suspected hot path had no breadcrumb in the log, so it had never shown up in a stall line. So the first step of the fix was to instrument the suspect and measure before changing anything.
What the measurement said
The field logs showed chat histories of 58 to 245 MB after long unattended sessions. At 245 MB, one append took 11.8 seconds, because an append still read the whole column and wrote the whole column back. And every transcript refresh, which ran every two seconds during a stream, read the whole history, cloned it over to the window, and parsed it there.
Then p0 wrote a script to find out what those bytes actually were. On a copy of a real database, the ten largest histories:
| Where the bytes were | Share |
|---|---|
| Tool results | 81% |
| Tool inputs | 11.5% |
| Actual text | 5.8% |
Forty-one percent of all bytes were base64 image data inside tool results. Screenshots the agent took. Images it read. PDFs it opened. The transcript never renders any of it. We were storing it, re-reading it every two seconds, shipping it across process boundaries and parsing it, for nobody.
The fix, in four steps
p0 delivered the fix as four steps, each reviewable on its own.
- Measure. Every full-history read gets a breadcrumb with its byte count, so stall lines can name it.
- Store less. Images and PDFs inside tool results become a short marker like
Image (412 KB) not stored. Oversized tool output keeps a head and a tail. Your messages, the agent’s text and its reasoning are never touched. Nothing stored ever goes back to a model, and a test enforces that. - One row per message. A new table replaces the single blob. Appending a message inserts one row, so its cost no longer depends on how long the session has been running. Existing histories convert in the background in small, resumable chunks.
- Fetch only what’s new. The window keeps a cursor and asks for the messages after it, plus the one in progress.
Measured with a 100 MB history during a streaming turn, 40 refreshes:
| Before | After | |
|---|---|---|
| Bytes per refresh | 104.9 MB | 70.6 KB |
| Parse and apply | 132.7 ms | 7.4 ms |
| Peak window memory | 1,633 MB | 240 MB |
A final pass finished the rendering side. Every message group except the newest is marked so Chromium skips layout and paint for rows you’ve scrolled past. On a seeded 1,822-message transcript, a full relayout went from 374 ms to 17 ms. The remaining file I/O that could block the main thread, like plugin installs and shell start-up, went async.
How p0 was used
Every change above was built in a p0 session, and that isn’t the interesting part. The interesting part is what the sessions were for.
The early ones were investigations, not builds. p0 read the user’s performance log, pulled the exception data from our analytics, traced the code paths that could produce that stall signature, and wrote a spec whose first section was the field evidence and whose second section was labeled a hypothesis. When it couldn’t prove the hypothesis from the data it had, it said so, and the first ticket became “add the breadcrumb that would prove it.”
When it did build, it measured first. The byte-attribution script existed before the storage cap did. The before-and-after tables in this post came out of scripts p0 wrote and ran against copies of real databases. Then it drove the packaged app with a seeded transcript to confirm the numbers held in the actual window.
And it was precise about what it had verified. When no Windows machine was available on the day, the PR description said so and included a checklist for us to run on one. Our testing standards ask for that, and p0 follows them.
The hard part of a performance bug is never the fix. It’s knowing which fix. What moved us forward each time was a log line that named an operation, a script that counted bytes, and a spec that refused to assume. p0 is good at exactly those things, and it’s patient enough to do them before touching code.
If you’re on Windows, p0 1.0.67 is the release where the white window stops. If you’re on a Mac, it’s the release where long sessions stop feeling heavy, and now you know why.
— Mario